Exploration 1
I Love That Graph
by Elizabeth Gieseking
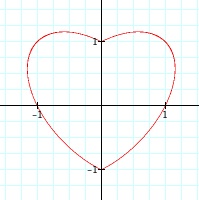
If you graph the relationship
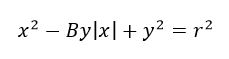
, the resulting graph looks like a heart which crosses the x and y axes at (0,1), (1,0), (0, -1), and (-1,0). Since this equation is similar in form to the equation of a circle, we might think that these intercepts can be changed by varying the constant at the end of the equation. In fact if we vary this constant as
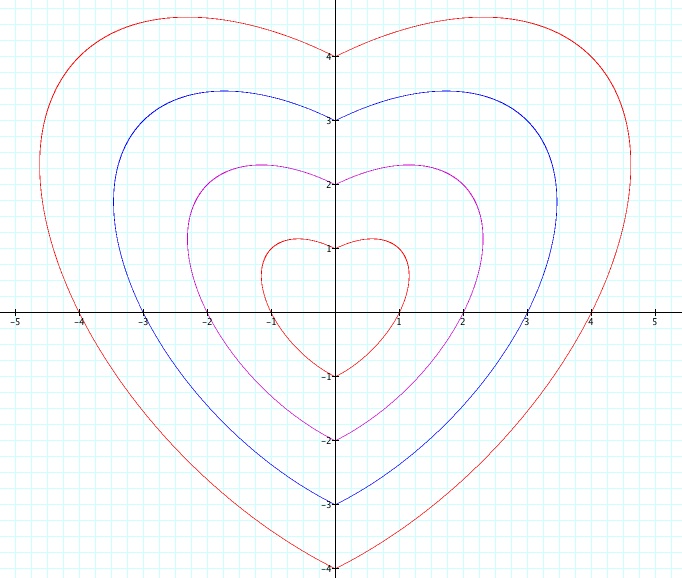
we see that the intercepts are the values of r. Below is the graph of the equation with r values of 1, 2, 3, and 4.
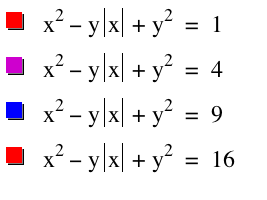
We can change the shape of our heart by changing the middle coefficient. In all of the following graphs, the r is kept constant at 4, but the middle coefficient is varied from 1 to 1.8.
We see in these graphs, as the middle coefficient is increased, the lobes of the heart become more elongated.
The question remains, why does the graph have this heart shape?
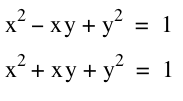
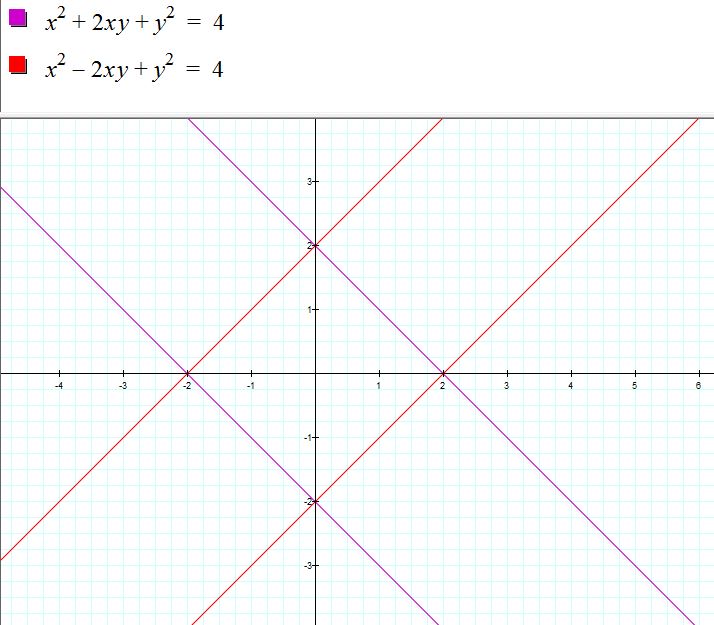
Our original equation contains an absolute value. We can remove the absolute value and graph the two equations:
This gives us the graph of two ellipses, one with the major axis rotated 45 degrees counterclockwise from the x-axis, and the other rotated 45 degrees clockwise from the x-axis.
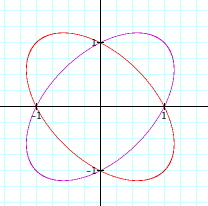
Let's compare the graph of the purple ellipse and that of the heart shape obtained by taking an absolute value. The regions to the right of the y-axis are identical. The equation of the heart results in a figure which is symmetric about the y-axis, while the ellipse is symmetric about the lines y=x and y=-x.
If we change the sign of our middle coefficient, we find that our heart has flipped upside down. We are now reflecting the other ellipse over the y-axis.
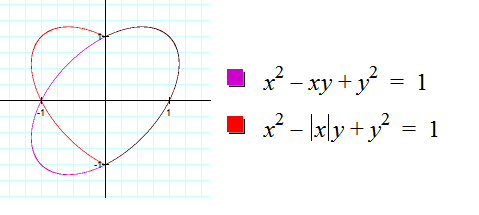
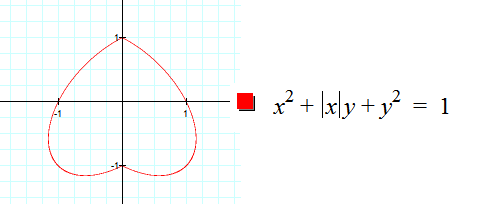
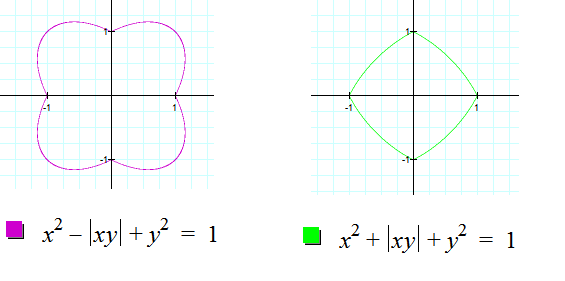
What if we put both the x and the y inside the absolute value? In the image on the left, we subtracted the absolute value of xy and got the union of the areas of the two ellipses. On the right, we added the absolute value and got the intersection of the areas of the two ellipses.
Next we will look at the reason behind the changing shape of the heart when we change the coefficient of the second term.
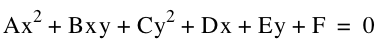
The general equation for a conic is:
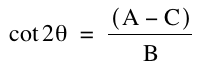
The rotation of the conic is found from the equation:
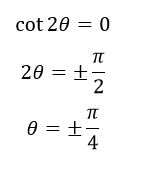
In our equation above, A=C=1, so
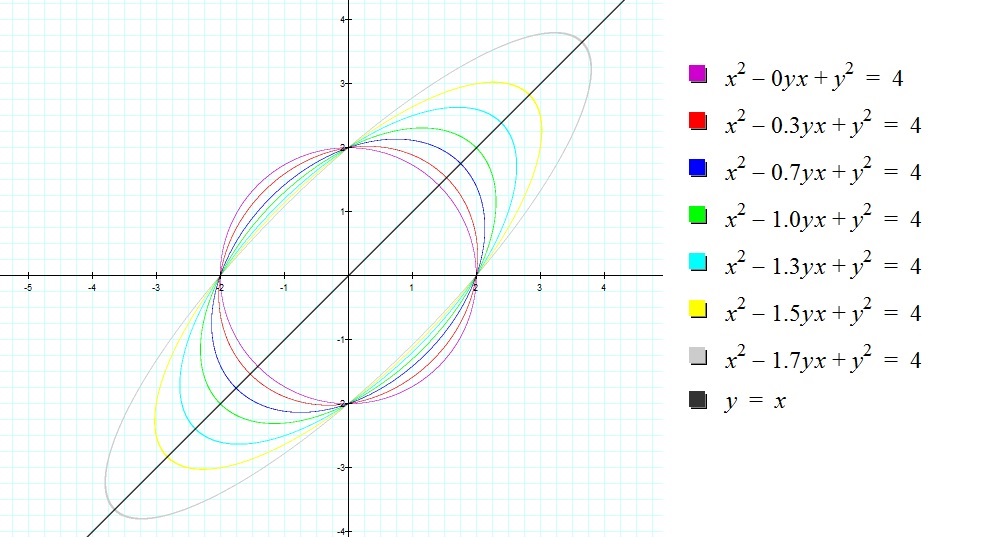
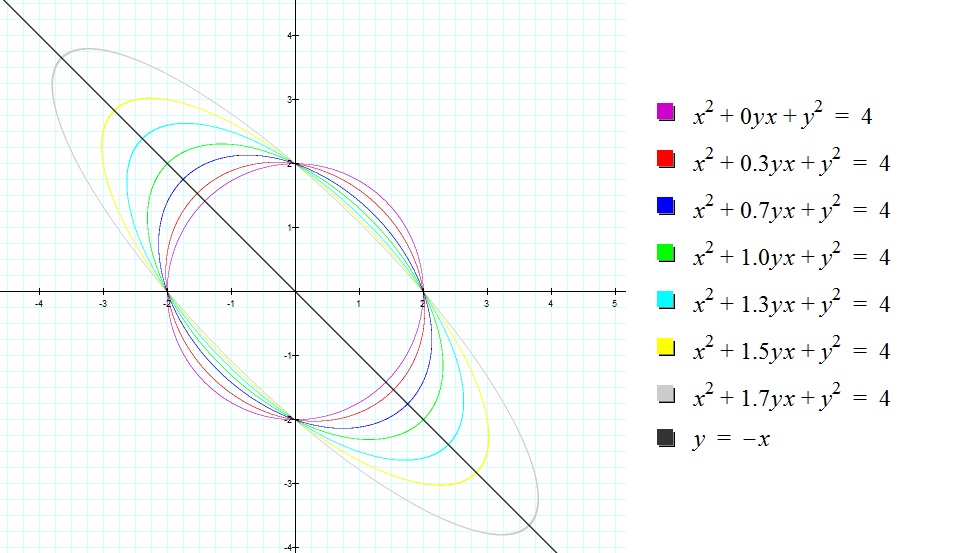
From these equations, we see that the cotangent is not affected by the value of B, since the numerator is zero. However, the angle of rotation is affected by the sign of B as shown in the following two graphs.
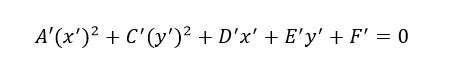
Looking at these two graphs, we see that when B=0, we have a circle. We will consider the non-rotated ellipse as having its major axis along the y-axis. If B is negative, the angle of rotation is negative and if B is positive, the angle of rotation is positive. We can also examine the effect of B on the shape of the ellipse. As |B| increases, the ellipse becomes more eccentric. The major axis increases and the minor axis decreases. We can rotate the axes to find the equations of the unrotated ellipses and thus calculate the lengths of the major and minor axes as we vary B. Our goal is to rotate the axes to x' and y' such that we eliminate the x'y' term and the new equation of the conic is:
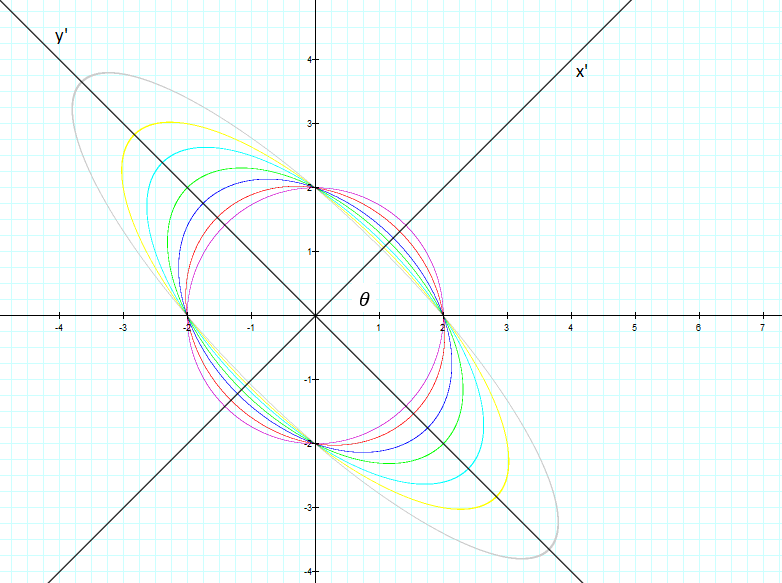
In this diagram we will rotate x' and y' by
from the original x and y axes.
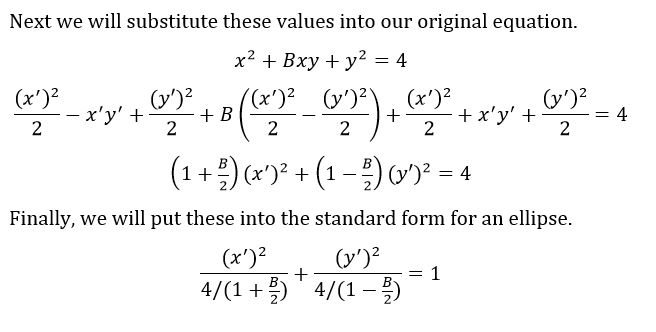
We can find the coefficients of the new equation by making the following substitutions.
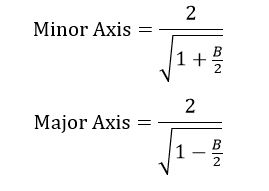
From this equation, we can calculate the lengths of the major and minor axes of our ellipse.
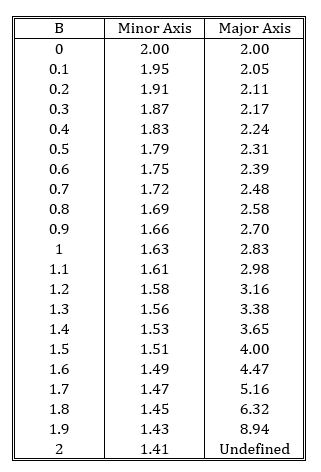
Now we will constuct a table of values for the minor and major axes as we vary B.
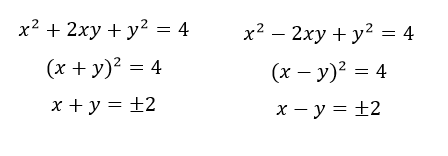
From this table, we see the minor axis slowly decreasing and the major axis increasing, slowly at first, and then quite rapidly as B approaches 2. We get an undefined value for the length of our major axis when B = 2. Let's examine why this happens. When B = 2, our original equations become:
We can see that these equations do yield lines rather than ellipses on the following graph.
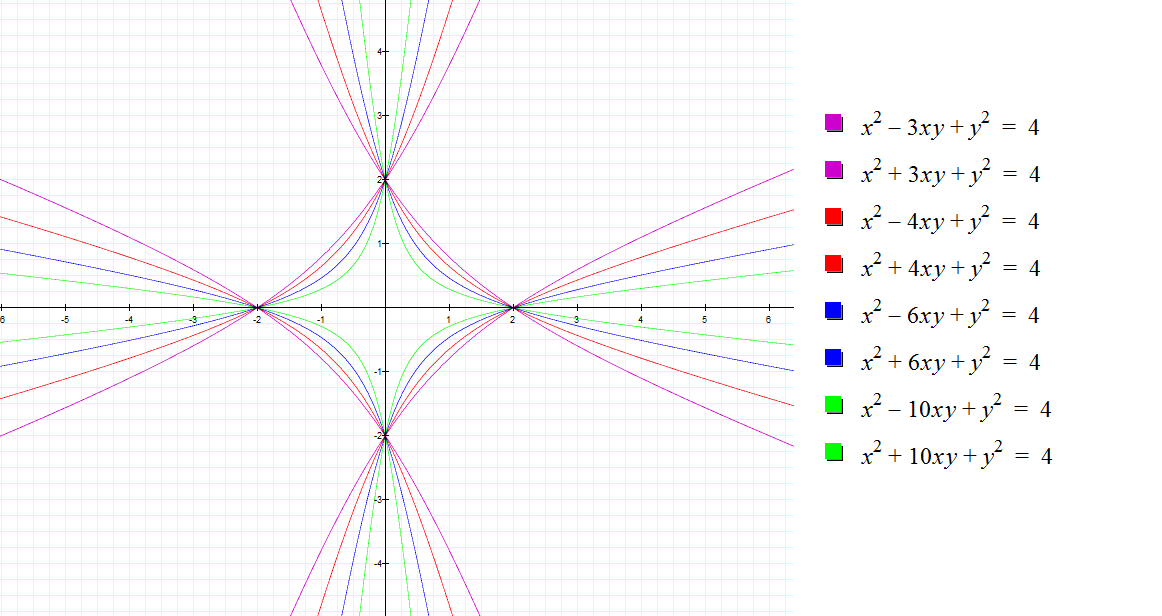
Finally, we will look at what happens when we choose values for B that are greater than 2.
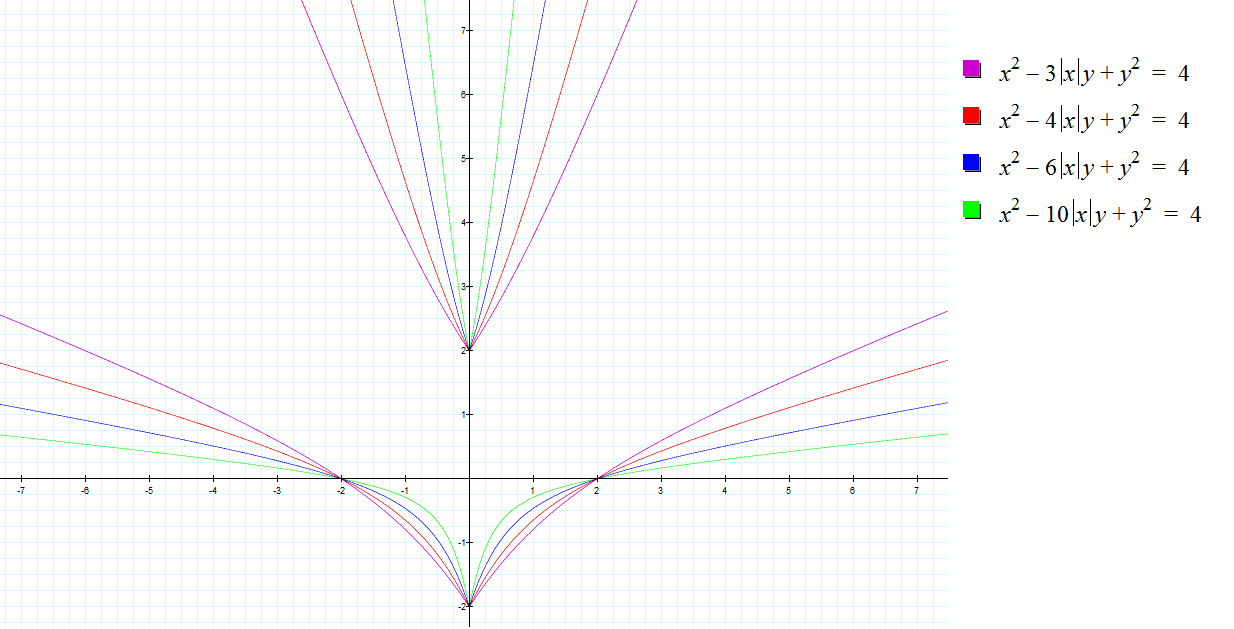
We see that we no longer have ellipses for our graphs, but instead have a series of hyperbolas. When we put the absolute value back into our equations, these are the resulting graphs.
Now we will summarize what we discovered from our general heart equation,
- The size of the heart increases as we increase r.
- The lobes of the heart become longer and thinner as B goes from 0 to 2.
- If B = 2, we no longer have a heart, but instead have two pairs of parallel lines.
- If B >2, we get two separate regions which are pieces of hyperbolas, rather than ellipses.
Return to Elizabeth's Home Page